The Portland Press Herald spent months collecting, charting and analyzing data about Portland and its neighborhoods. The sources range from the U.S. Census to Portland Police Department crime logs to City Clerk dog registrations. In some cases where there was no available data, such as determining current rent prices, the newspaper did original research and built databases to help tell the story.
Here is an explanation of some of our numbers and maps.
Census tracts and neighborhoods – Census tracts generally correspond to commonly recognized neighborhood boundaries, but not in all cases. For example, India Street and East Bayside are distinct neighborhoods but they share a single census tract. The same is true for Stroudwater and Libbytown. In other cases, smaller neighborhoods are absorbed by adjacent ones. Deering Highlands is within the Rosemont census tract, for example, and Valley Street is within the West End tract.
In addition, The U.S. Census has moved tract boundaries and combined tracts over the last four decades. The newspaper standardized the tracts as much as possible to correspond with the current boundaries. In some cases, statistics for an individual neighborhood are presented as a range. This is because the neighborhood includes multiple census tracts and some figures could not accurately be combined or averaged.
Current rents – The newspaper monitored ads for two-bedroom apartments citywide in September and early October. More than 100 listings were culled from Craigslist and the Portland Press Herald/Maine Sunday Telegram classified ads. Average rents include heat and utilities. If an apartment listing did not include heat and utilities, $140 was added to the monthly cost, based on federal housing guidelines for utilities expenses in the Portland market.
In a small number of neighborhoods, there were not enough apartment listings to generate a current average rent price.
Note: These market rents tend to represent the leading edge, or higher end, of the market. Long-term tenants may pay significantly less.
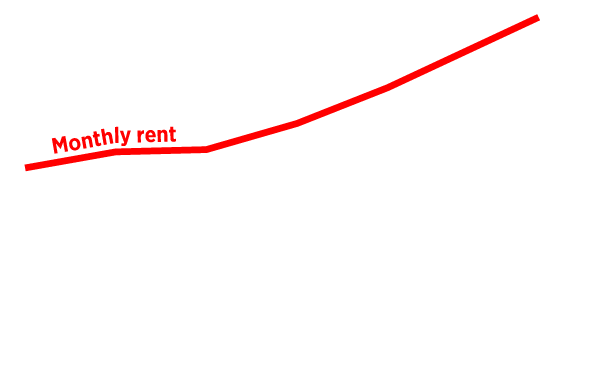
Historic rents – The U.S. Census tracks gross rent, which represents median base rent plus heat and utilities, that is being paid by all renters at the time. These figures, which include public housing and subsidized apartments, tend to be lower than current market rents, but provide comparative information. The Maine State Housing Authority conducts quarterly market rate surveys for two-bedroom apartments including utilities and calculates the annual average.
Income – The U.S. Census is the source for overall median incomes for the city and individual neighborhoods. However, census data for median renter household income has a higher margin of error because it represents a smaller slice of the population, especially when examining individual neighborhoods. The Maine State Housing Authority provided median renter household income for the city from 2000 through 2014. The data are compiled for the housing authority by Claritas, a private research company that uses census and other information to develop a consistent set of data over time. There was no reliable source of renter income data by individual neighborhood.
Neither the census nor the housing authority has released data about 2015 renter income.
Note: All the data available show that overall median household income has risen in recent years, but that median income for the renter households – non-property owners – has declined or stagnated.
Affordability Gap – The newspaper used Maine State Housing Authority data for median renter household income citywide and for market rates of the average two-bedroom apartment from 2000 through 2014. To calculate the affordability gap, the newspaper used 30 percent of the monthly income of the median Portland renter household as the “affordable rent” standard. The difference between the market rent and the affordable rent is the affordability gap.
Decline of middle-income households – The Portland Press Herald analyzed the U.S. Census breakdown of Portland renter households according to income level for 2000 and 2014. To remove the influence of income inflation, the newspaper converted the income categories from dollars into percent of median income. The resulting categories, from very low to high, are almost identical for 2000 and 2014, although some slight variations were unavoidable given the data available. For example, the threshold between upper middle income and high income is 141 percent of median in 2000 and 148 percent of median in 2014. All other thresholds were within two percentage points.
Dog breeds and names – The Portland City Clerk’s office provided the list of dogs that were licensed as of February 2015. Feb. 1 is the annual deadline for registering dogs and avoiding the possibility of a state fine. That said, puppies have been born, dogs have died and many people don’t register their dogs. The newspaper sorted the list of registered dogs by breeds and names and used addresses of dog owners to sort them by neighborhood.
Crime data – The Portland Police Department provided incident call data from Aug. 1, 2014, to Aug. 1, 2015, for assaults, burglaries and motor vehicle thefts. The city’s data were broken down by police precincts (beats) and the Press Herald used individual addresses to sort the calls by neighborhood.
Note: Locations of calls may in some cases reflect where a report came from rather than the location of the alleged crime.
Walkability and bikeability ratings – Ratings are calculated by walkscore.com. The walkability score is determined by proximity to amenities and pedestrian friendliness. A score of 90 to 100 means daily errands do not require a car, while a score of 0 to 24 means almost all errands require a car.
The bikeability score is based on such factors as bike lanes and trails, destinations, road connectivity and the number of bike commuters. A score of 90 to 100 means daily errands can be accomplished on a bike and a score of 0 to 49 means a neighborhood has minimal bicycle access.


